Interactive 3D maps
PyWorldAtlas can open a rotatable country terrain map directly from Python.
The viewer runs in the default browser because WebGL provides smooth,
cross-platform 3D interaction. After installation, the map data and viewer are
fully offline: show() writes a local HTML document and opens that file.
Warning
Experimental feature. Interactive 3D maps are under active development. River overlays and country geometry may be incomplete, generalized, or misplaced. Countries and areas containing islands, distant territories, or separated land areas may render unexpectedly. These maps must not be used for navigation, legal boundary interpretation, or authoritative geographic analysis. This feature may change substantially or be removed before version 1.0.
TL;DR: The maps are fun, but right now this feature is a bug-shaped headache. It may settle down before 1.0, or it may be politely shown the door.
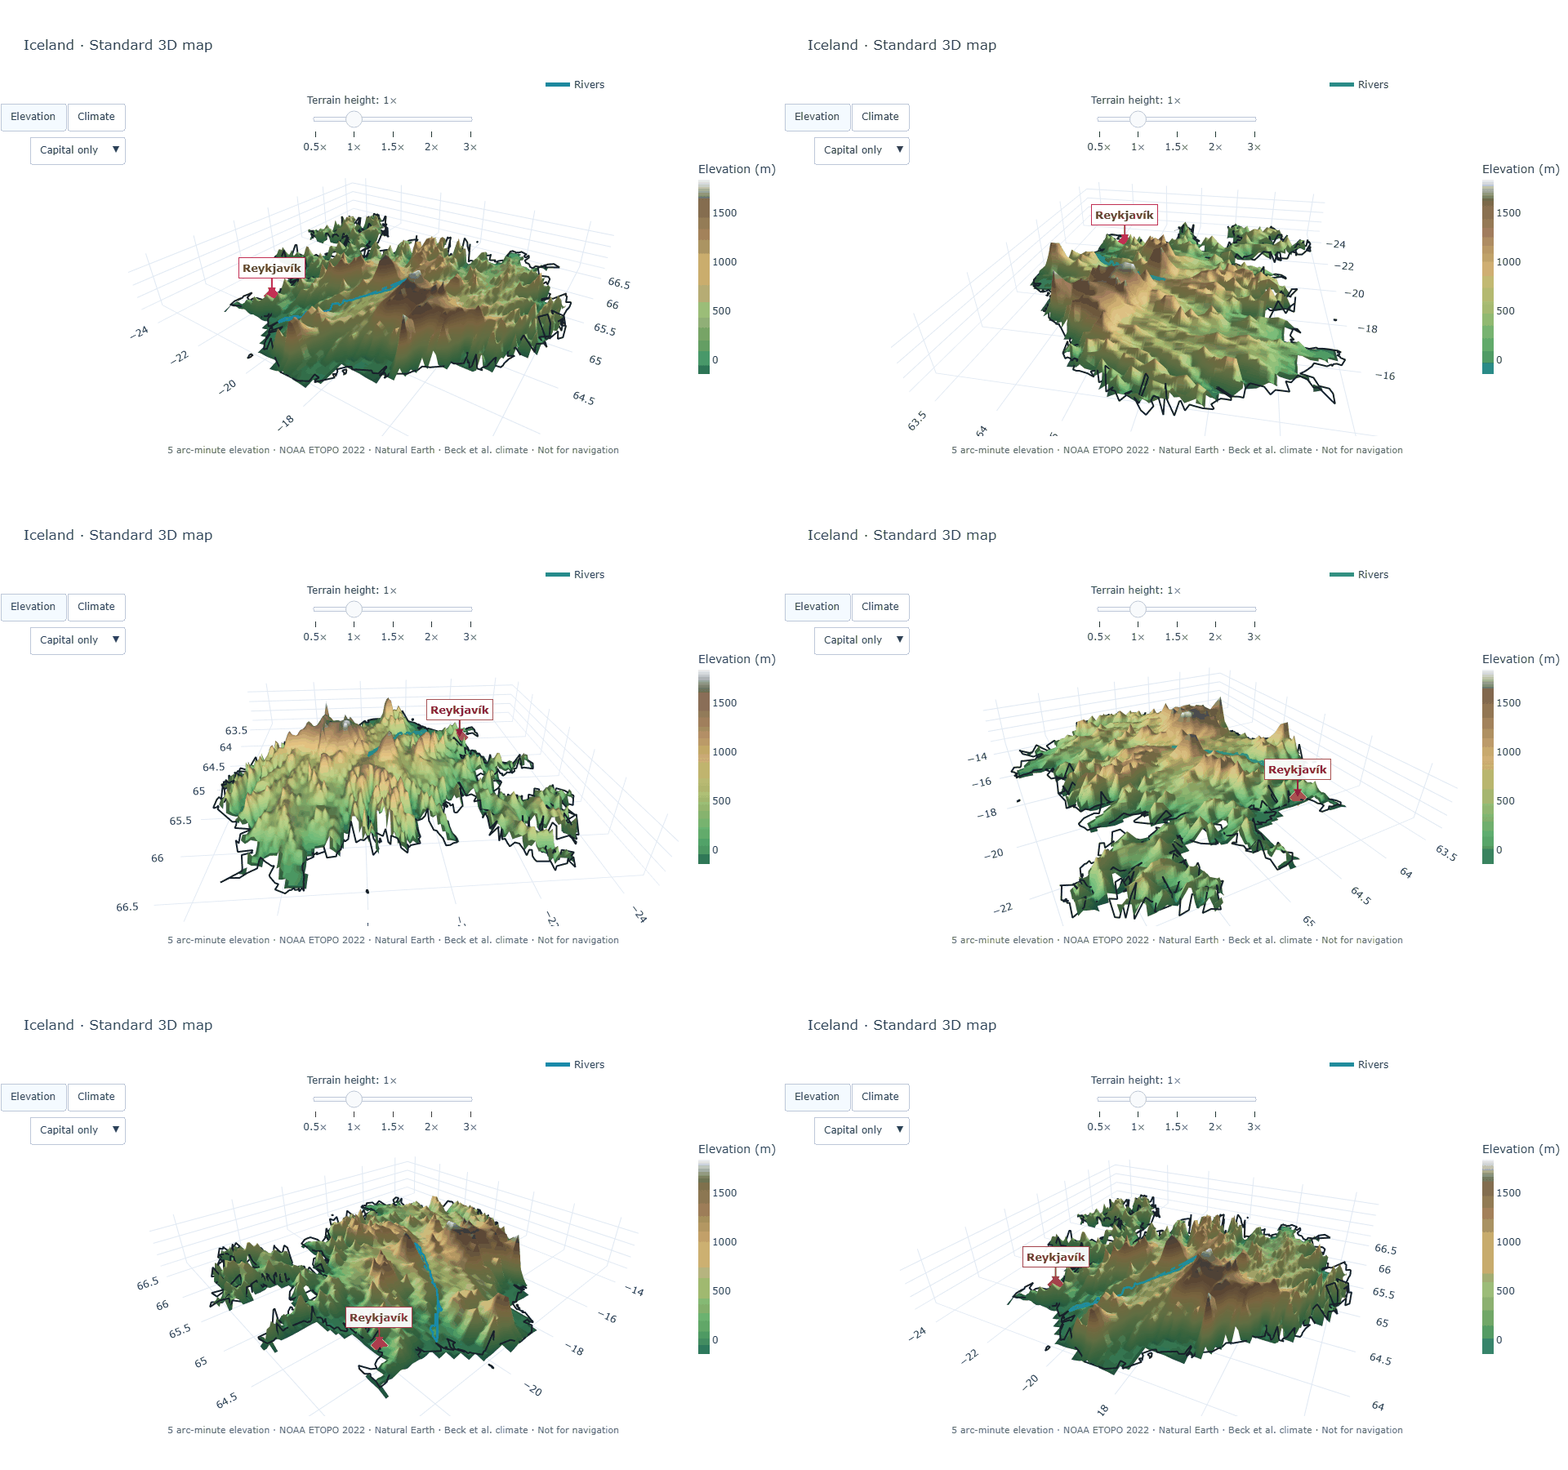
A complete turn from the real Standard-edition map of Iceland. Rotate and zoom the live view, adjust terrain height, control river and capital labels, or switch from elevation to climate without contacting a server.
Choose a map edition
The ordinary package remains small and dependency-free. Add exactly one map edition when interactive maps are wanted:
Install |
Elevation sampling |
Data wheel |
Best for |
|---|---|---|---|
|
20 arc-minutes |
about 2.1 MB |
Lessons, quick exploration, and modest computers |
|
5 arc-minutes |
about 8.2 MB |
The recommended general-purpose experience |
python -m pip install "pyworldatlas[maps]"
Overview and Standard cover the same 248 profiles and expose the same API. Standard simply samples the pinned elevation surface more densely and uses a more detailed river layer. Detailed and Ultra editions are not part of 0.9.
Open your first map
from pyworldatlas import Atlas

with Atlas() as atlas:
    atlas.map("Iceland").show(auto_rotate=True)
That one call opens a standalone browser view containing:
rotatable and zoomable 3D elevation;
five terrain-height settings from
0.5×through3×;play and pause controls with an adjustable
0.25×to3×rotation speed;an elevation or Köppen-Geiger climate surface switch;
generalized country outlines;
source-provided river centerlines with hover details and optional names;
a high-contrast primary-capital marker with a selectable label;
high-resolution PNG export of the current camera view; and
visible resolution, source, and navigation-use notes.
show() returns the generated Path, so applications can
log or reuse the exact local document.
Rotation is off by default, keeping ordinary map use still and predictable.
Pass auto_rotate=True for presentations or demonstrations, and choose a
starting speed when wanted:
with Atlas() as atlas:
    atlas.map("Iceland").show(
        auto_rotate=True,
        rotation_speed=1.25,
    )
The browser controls can pause or change that speed at any time. Moving the camera manually pauses automatic rotation, and browsers configured to reduce motion do not start it automatically.
Select a quality explicitly
quality="auto" is the default. It prefers Standard when installed and
otherwise uses Overview. An application can request a specific installed
edition when reproducibility matters:
>>> from pyworldatlas import Atlas
>>> with Atlas() as atlas:
...     brazil = atlas.map("BR", quality="overview")
...     print(brazil.country_name, brazil.quality, brazil.resolution_arc_minutes)
Brazil overview 20
Use quality="standard" or quality="overview". A missing edition raises
MapSupportNotInstalledError with the exact installation
command rather than silently downloading data.
Notebooks, customization, and export
Use pyworldatlas_mapview.CountryMap.figure() to obtain the underlying
Plotly figure. It can display inline in a compatible notebook or be customized
with normal Plotly methods:
with Atlas() as atlas:
    map_view = atlas.map("Japan")
    figure = map_view.figure()
    figure.update_layout(height=760)
    figure.show()
Write a permanent, self-contained HTML document without opening it:
with Atlas() as atlas:
    atlas.map("Switzerland").write_html(
        "switzerland-map.html",
        auto_rotate=True,
        rotation_speed=0.75,
    )
The exported document embeds the renderer and selected country data. It does not depend on a CDN or a running Python process. Select Download PNG in the viewer to save a crisp 3200 × 1800 image of the current camera angle. The camera icon in Plotly’s toolbar uses the same high-resolution settings.
Create a documentation GIF
The repository includes a maintainer utility that renders one seamless turn from the real Plotly figure. GIF dependencies stay outside the published runtime packages:
python -m pip install Pillow kaleido
python tools/create_map_gif.py Iceland --quality standard --seconds 6 --fps 10 --output docs/source/_static/iceland-rotation.gif
The default 960 × 600 render uses 128 colors to keep project-page downloads
reasonable. It uses a presentation-friendly perspective camera by default;
pass --projection orthographic to match the viewer’s initial projection.
--width, --height, --scale, --zoom, and --colors are
available when a different balance of sharpness and file size is needed.
Kaleido requires a supported local browser for static rendering.
Data meaning and limits
Elevation comes from the NOAA NCEI ETOPO 2022 ice-surface global relief model. Standard samples the 60 arc-second source every five cells; Overview samples the same pinned snapshot every twenty cells. The maps are educational relief visualizations and are not suitable for navigation or site-level elevation decisions.
Climate coloring uses the pinned Beck et al. 1991–2020 Köppen-Geiger raster. Outlines and river centerlines use generalized Natural Earth data. The outline supports visualization only: 0.9 does not expose boundary coordinates, GeoJSON, point-in-country tests, or legal boundary claims through the public API. Small islands and narrow coastlines can be visibly generalized at the selected elevation resolution.
See Data sources and freshness, Data quality and limitations, and Educational purpose and editorial policy for the complete source, editorial, and interpretation policies.